
Docs · Guide
Reporting
Building Reports
Reports are built from the Reports Page. The default Report is "Untitled report" that shows every job from every project both owned by and shared with the user, within the last 7 days. New reports can be created or viewed from the drop-down menu.
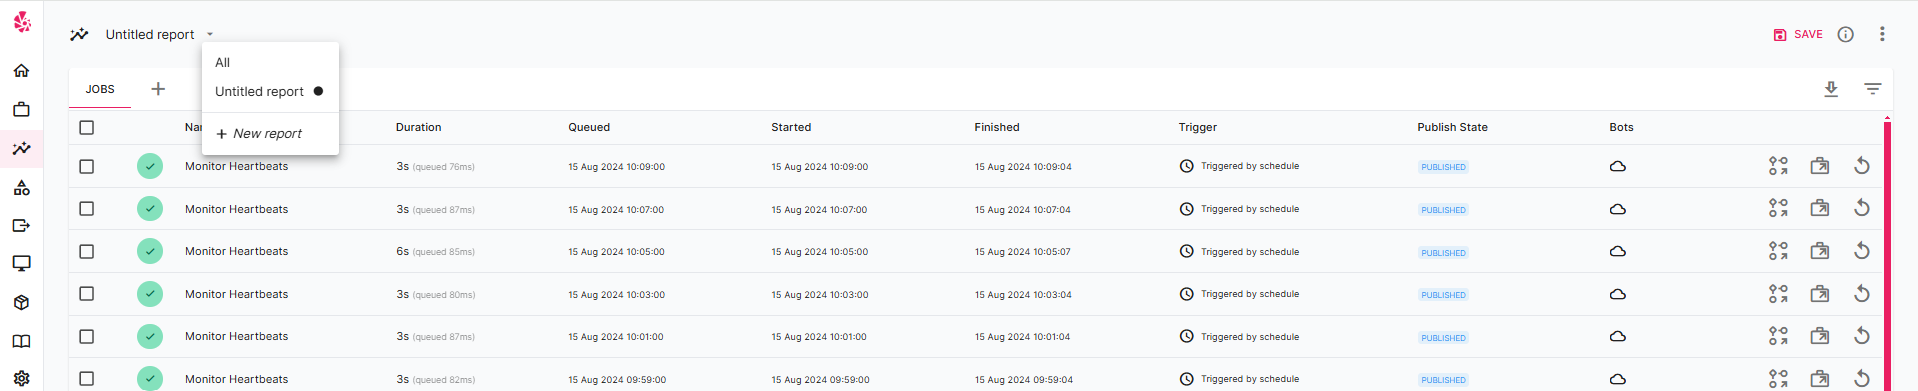
A report is simply a query of all Job Reports accessible by the user:
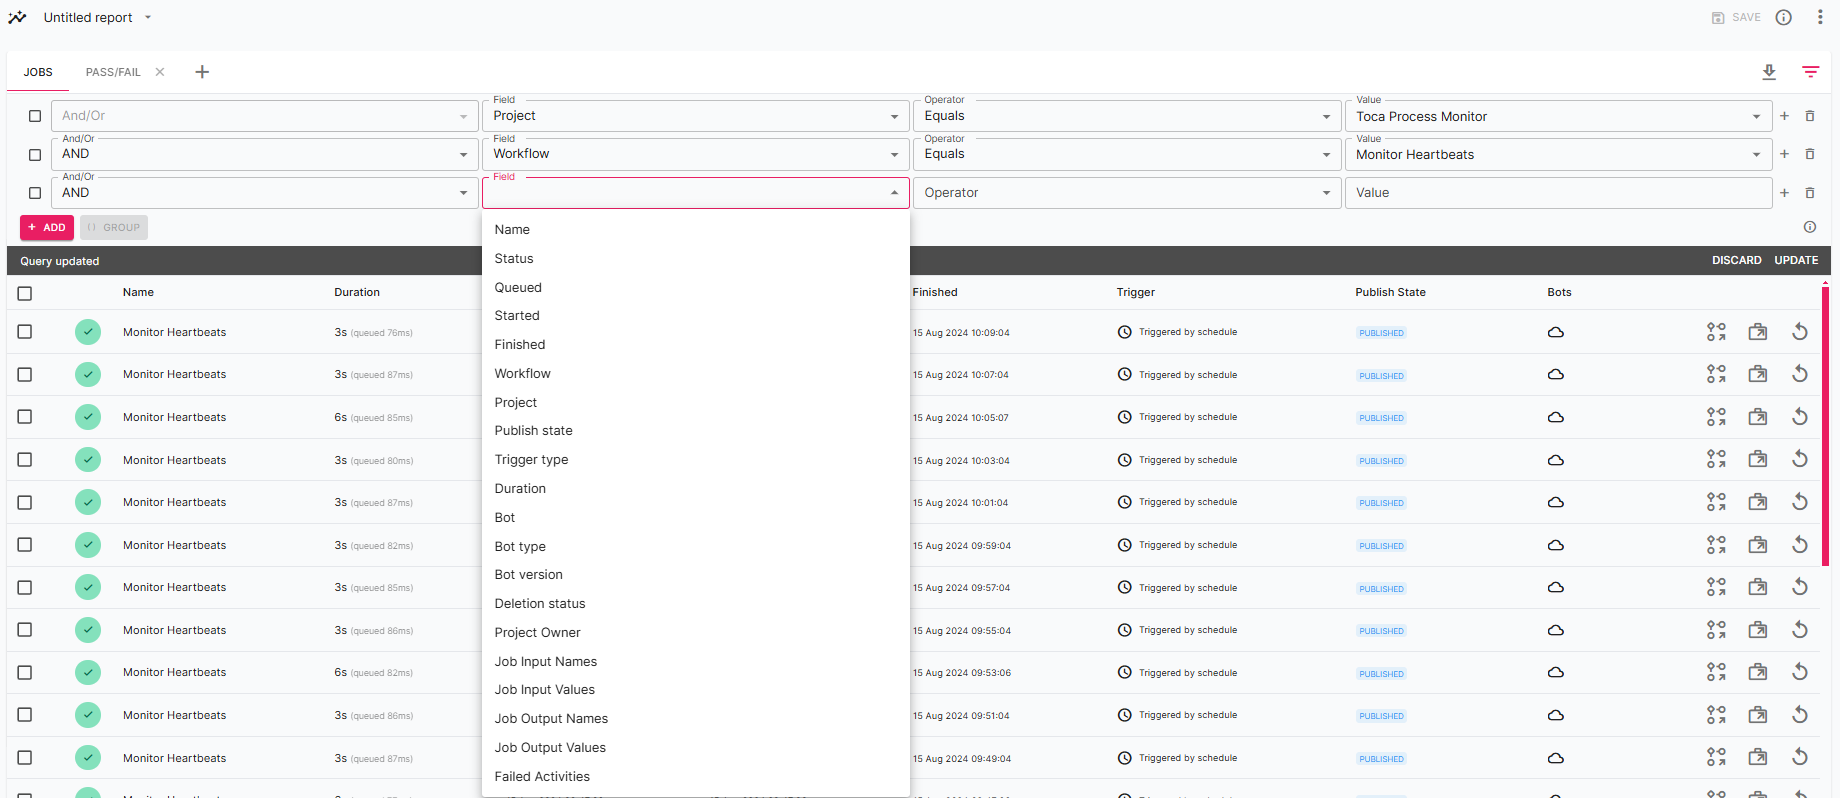
Just combine query elements, pressing UPDATE to run the query and pressing SAVE to commit the query to the Report.
The queried Report can be downloaded in CSV format by clicking the Download icon (down arrow).
Reporting Dashboards
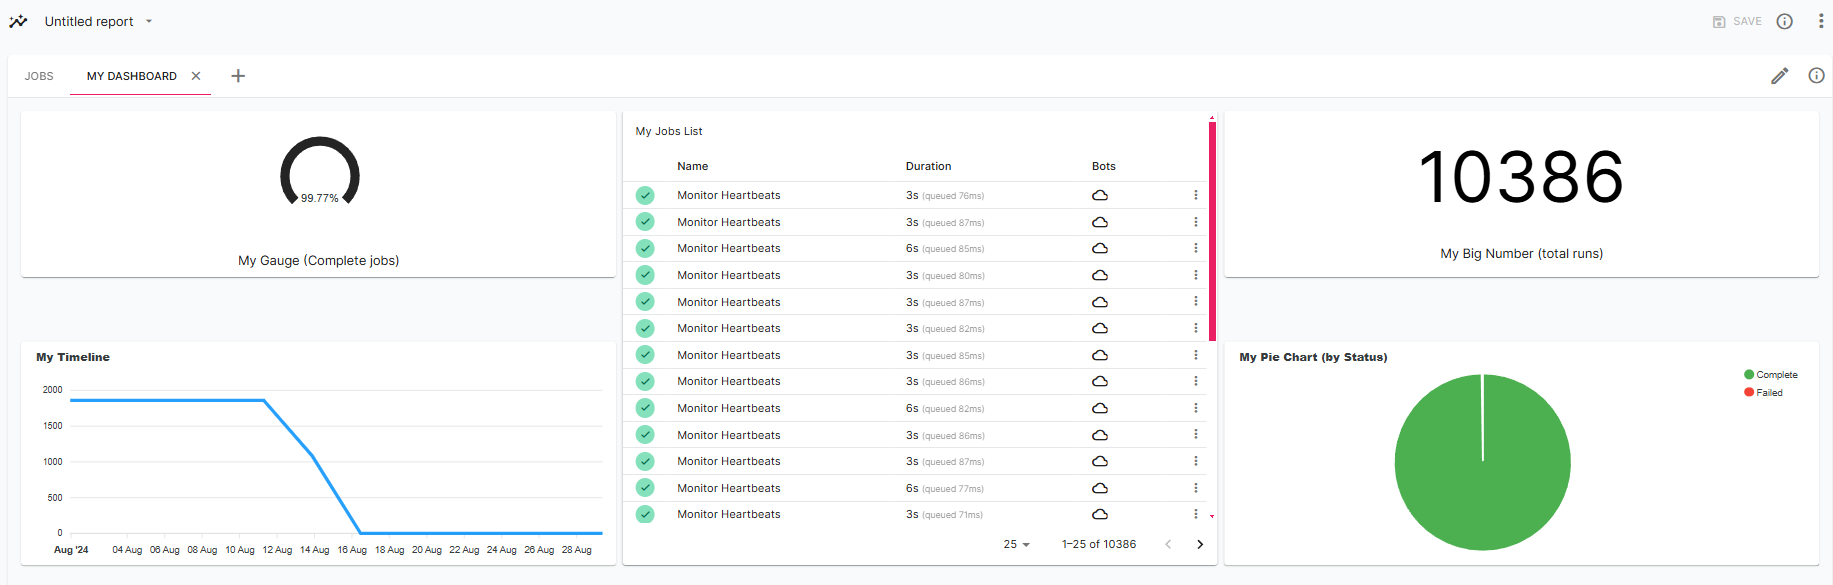
Dashboards are a way of visualising your reporting data with a variety of customisable widgets. By customising the content and appearance of widgets you can create powerful and aesthetically pleasing dashboards which fully represent the work you are doing as part of Toca automation. Because each report can have multiple dashboards, you are not limited in the way that you wish to present your reporting data.
Widgets
Widgets are small components which can be used to display data in a dashboard. Each widget can have its output customised by editing the query inside of it. The query of each widget will, by default, match the query of the overall report, but this can be augmented or changed. The following widgets are available:
- Gauge
- Jobs list
- Timeline
- Big number
- Pie chart
Adding and Editing Dashboards
Press + to add a new Dashboard - just give it a useful name - or just click on a current Dashboard.
With the Dashboard displayed, click the pencil icon to enter edit mode (click it again to leave edit mode)
Changes to Dashboards will require the Report to be saved by clicking SAVE.
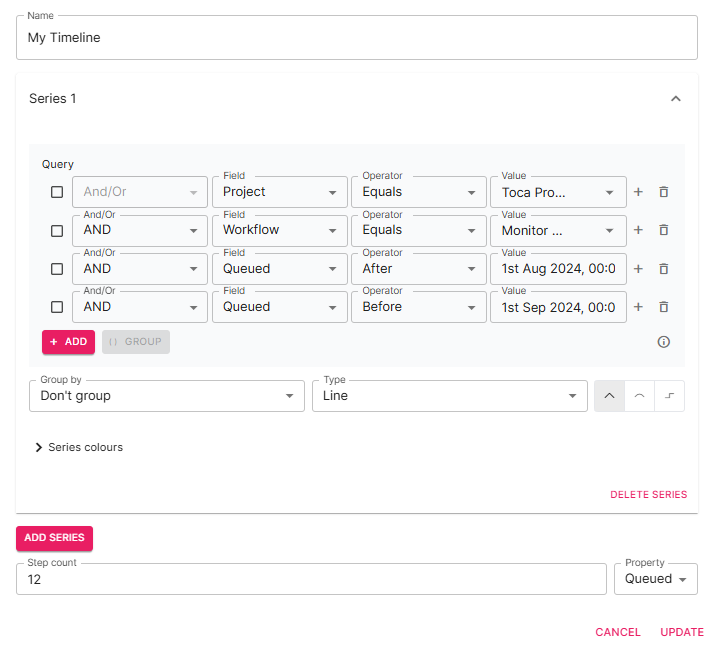
Widgets are added, by clicking the white + on the bottom right of the screen. This brings up icons to select the widget type which when clicked brings up a model where the Widget can be configured using both a query and for styling.
Shortcuts
Space- Enable edit mode.Esc- Disable edit mode.
Report Management
Report Data Stored
Every Report produced by executing a Workflow consume a finite amount of disk space.
The amount of disk space consumed by a Report depends upon:
The number of Actions being executed
Even a small Activity containing loops will generate a lot of Report data
The type of Actions being executed
Data rich Activities containing large tables, large string variable and images generate a lot of Report data
The configured Workflow Report level
The configured Report level defines how much data is stored:
Debugstores all Report dataActionstores the Action names, but no dataNodesstores the Workflow nodes executedErrorsstores data only from errored Actions
It would be useful to configure all Workflows Report level as Debug, but this could rapidly fill up the disk and reduce the capacity of the Toca platform performance.
Cleaning Up Reports
Reports can be deleted at will by:
- Selecting one or more reports using the checkbox on each Report row
- Clicking the Delete selected jobs icon that appears
Reports can also be deleted by creating and running a filter:
- Click on the Report ellipsis (3 dots) on the Report page revealing the Report management menu
- Click on Delete job data to bring up the Filters model
- Either click on an existing Filter, or click
+ NEW - Complete the query builder to match the criteria of Job Data you want to delete
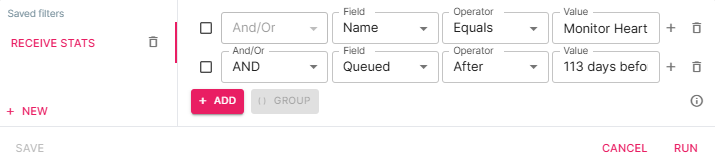
- Click
RUNand a confirmation pop-up appears
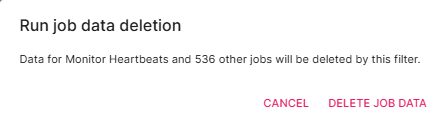
- The pop-up confirms the number of Jobs that will be deleted
- Click
DELETE JOB DATAto schedule deletion of the Job Data.
The Delete Jobs Data Action can be used in an automation Activity to instigate the deletion of Job Data using a pre-configured Filter.